American 🇺🇸 & Italy 🇮🇹
The 🇺🇸 follows the Italian one at the bottom of the post
🇮🇹🇮🇹 versione italy 🇮🇹🇮🇹
Buongiorno steemers 🐳
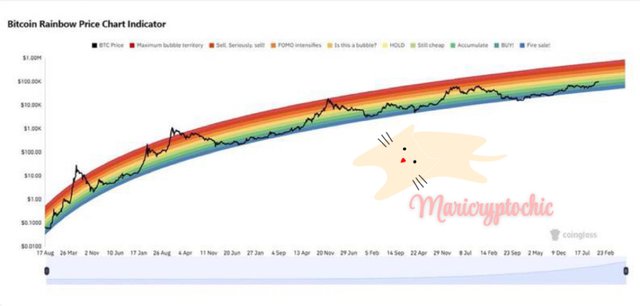
Oggi volevo Analizzare la situazione il grafico arcobaleno 🌈 di bitcoin
Il grafico BITCOIN rainbow è un bellissimo indicatore.
Ci mostra che il ciclo precedente non ha raggiunto il tipo di euforia a cui solitamente assistiamo in un ciclo di Bitcoin.
A causa di questo, le aspettative relative a tale ciclo si sono notevolmente abbassate con l'insorgere del disturbo da stress post-traumatico.
Secondo l'indicatore del Rainbow Chart, qualsiasi cosa:
Al di sotto dei 110.000 $ è classificato come "Accumulo"
Tra $ 110-150K è classificato come "ancora economico"
Per entrare nelle regioni rosse, la valutazione deve aumentare fino a:
oltre $250.000
$375K+ per il primo colore rosso (e stessa fase del ciclo del 2021).
Più passa il tempo, più aumenta la valutazione.
Ad esempio, lo stesso colore che attualmente è rosso a $ 375K sarà a $ 470K entrando in agosto '25.
La gente letteralmente non si aspetta quanto sarà alto ed estremo questo ciclo.
Domanda 🙋🏽♀️
cosa ne pensate di questo grafico ? siete anche voi piu consapevoli che per forza di cose il grafico di bitcoin deve essere proiettato verso l alto per essere sostenibile nel lungo periodo per tutta l industria che ci sta dietro
Analisi a cura di Mari , trader nel mondo crypto dal 2023 🍓
Buona crypto analisi steemers ✨
Maricryptochic 💅
🇬🇧 Uk version 🇬🇧
Good morning steemers 🐳
Today I wanted to analyze the situation of the rainbow graph 🌈 of bitcoin
The BITCOIN rainbow chart is a beautiful indicator.
It shows us that the previous cycle did not reach the kind of euphoria we usually see in a Bitcoin cycle.
Because of this, expectations regarding this cycle have been significantly lowered with the onset of PTSD.
According to the Rainbow Chart indicator, anything:
Below $110,000 is classified as "Accumulation"
Between $110-150K is classified as "still affordable"
To enter the red regions, the rating must increase to:
over $250,000
$375K+ for the first red color (and same phase of the 2021 cycle).
The more time passes, the more the rating increases.
For example, the same color that is currently red at $375K will be at $470K entering August '25.
People literally don't expect how high and extreme this cycle will be.
Question 🙋🏽♀️
what do you think of this graph? are you also more aware that the bitcoin graph must necessarily be projected upwards to be sustainable in the long term for the entire industry behind it
Analysis by Mari, trader in the crypto world since 2023 🍓
Happy crypto analysis steemers ✨
Maricryptochic 💅

vorrei vedere quando si raggiunge il colore rosso dell arcobaleno
Downvoting a post can decrease pending rewards and make it less visible. Common reasons:
Submit
anchio +1 🤣
Downvoting a post can decrease pending rewards and make it less visible. Common reasons:
Submit
Downvoting a post can decrease pending rewards and make it less visible. Common reasons:
Submit