Ethereum is showing strong bullish momentum in the short-term 30-minute chart. Let’s break it down technically, and I’ll share a clear buy signal with proper entry, stop loss, and target levels for futures traders.
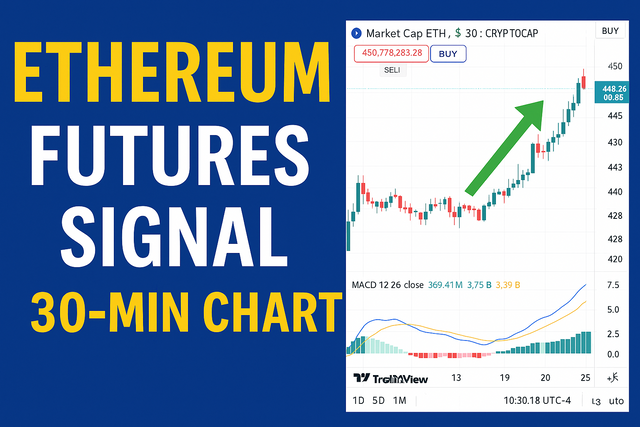
📊 Chart Overview: 30-Min Market Cap ETH (TradingView)
Timeframe: 30 Minutes
MACD: Bullish crossover confirmed
Volume: Increasing
Breakout Level: Clean breakout above $448B
Current Market Cap: ~$450.78B
Trend: Strong short-term uptrend
📈 Technical Analysis
MACD Crossover
The blue MACD line has clearly crossed above the signal (orange) line.
Histogram is green and expanding — a strong bullish continuation sign.
Bullish Flag Breakout
After a period of sideways movement (~18th-19th July), ETH broke out strongly upward.
Volume confirmed the move, showing that the breakout is not a fakeout.
Higher Highs & Higher Lows
Clear structure forming on this timeframe — momentum favors buyers.
✅ Futures Buy Setup (Scalping or Short Swing)
Parameter Value
Buy Entry $448B – $450B area (pullback zone)
Stop Loss $443B (below last small consolidation zone)
Take Profit 1 $455B (conservative)
Take Profit 2 $460B (aggressive swing)
💡 Risk-to-Reward (R:R) Strategy
R:R = ~1:2.5 if entering at $448B and exiting at $455B
Position Size: Keep risk < 1-2% of your capital
Ideal for short-term futures scalping (3–8 hour window)
⚠️ Risk Notes
If price drops below $443B, it may re-test support or even reverse.
Keep an eye on MACD histogram. If it shrinks and flips red, momentum may fade.
🔮 Market Sentiment
With Ethereum ETF speculation, rising DeFi activity, and altcoin season heating up — ETH market cap may continue upward. Short-term dips are potential buying opportunities on lower timeframes.
🧠 Final Thoughts
Ethereum is showing strong signals on the 30-min chart — and this breakout may just be the beginning.
Use proper risk management, follow your strategy, and let the trade play out. 🚀
💬 Do you think ETH will touch $460B+ in this cycle? Let’s discuss in the comments!