steemhub.tech continues to serve as the main domain for all sites related to the Steem blockchain. Currently, there are 4 active sites:
- memory-game.steemhub.tech - game for Steem community
- stats.steemhub.tech - Analytics dashboard for tracking performance
- pixelcraft.steemhub.tech - pixel art game for the community
- steemhub.tech - Main hub connecting all Steem-related projects
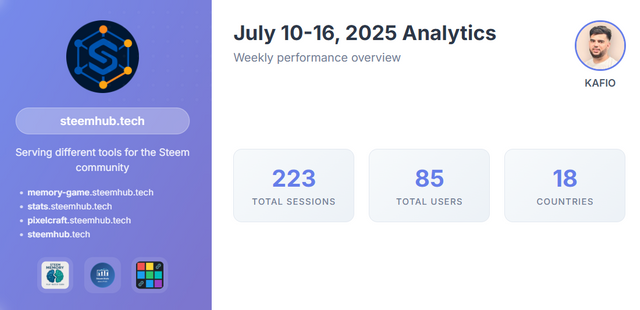
SteemHub serves different tools for the Steem community.
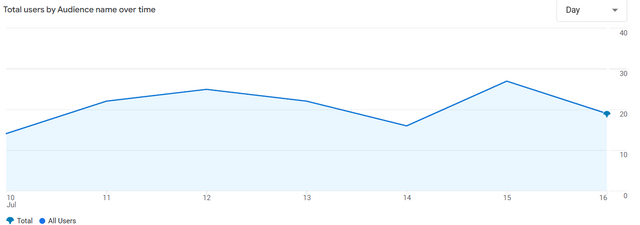
Reporting Period: July 10, 2025 to July 16, 2025
User Engagement Overview
Audience Analytics
| Metric | Value | Percentage |
|---|---|---|
| Total Users | 85 | 100% |
| Total Sessions | 223 | 100% |
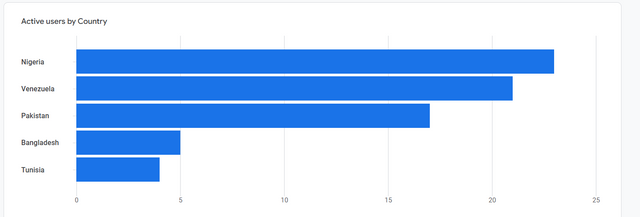
Geographic Distribution
Active Users by Country
| Country | Active Users | Percentage | Engaged Sessions |
|---|---|---|---|
| Nigeria | 23 | 27.38% | 42 |
| Venezuela | 21 | 25% | 31 |
| Pakistan | 17 | 20.24% | 34 |
| Bangladesh | 5 | 5.95% | 10 |
| Tunisia | 4 | 4.76% | 5 |
| China | 2 | 2.38% | 0 |
| Colombia | 2 | 2.38% | 4 |
| Indonesia | 2 | 2.38% | 1 |
| United States | 2 | 2.38% | 1 |
| Brazil | 1 | 1.19% | 0 |
| Cameroon | 1 | 1.19% | 0 |
| Chile | 1 | 1.19% | 7 |
| Egypt | 1 | 1.19% | 1 |
| France | 1 | 1.19% | 1 |
| India | 1 | 1.19% | 1 |
| Mauritius | 1 | 1.19% | 1 |
| Netherlands | 1 | 1.19% | 0 |
| Russia | 1 | 1.19% | 1 |
Technology Analytics
Browser Distribution
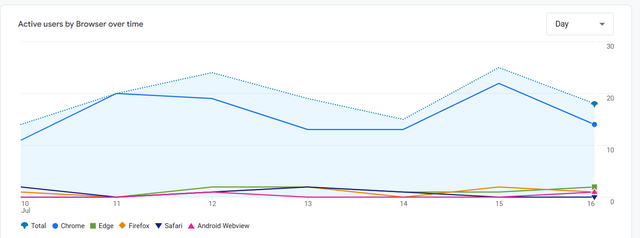
| Browser | Active Users | Percentage | Engaged Sessions |
|---|---|---|---|
| Chrome | 70 | 83.33% | 120 |
| Edge | 5 | 5.95% | 6 |
| Firefox | 4 | 4.76% | 4 |
| Safari | 3 | 3.57% | 6 |
| Android Webview | 2 | 2.38% | 2 |
Device Category Performance
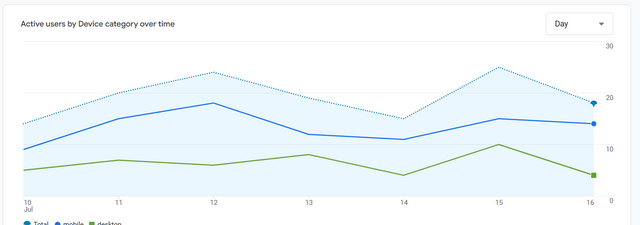
| Device Type | Active Users | Percentage | Engaged Sessions |
|---|---|---|---|
| Mobile | 60 | 71.43% | 105 |
| Desktop | 27 | 32.14% | 36 |
Key Insights
Device Usage Patterns
The data shows a strong mobile preference with 71.43% of active users accessing the platform via mobile devices, generating 105 engaged sessions (76.09% of total engaged sessions). Desktop users, while representing 32.14% of the user base, contributed 36 engaged sessions (26.09% of engaged sessions).
Geographic Performance
Nigeria leads with the highest user engagement, contributing 27.38% of total active users and 30.43% of engaged sessions. Venezuela follows closely with 25% of users and 22.46% of engaged sessions. Pakistan shows strong engagement with 20.24% of users generating 24.64% of engaged sessions.
Browser Dominance
Chrome maintains overwhelming dominance with 83.33% of active users and 86.96% of engaged sessions, indicating optimal performance on this platform.
Conclusion
This week's Google Analytics data reveals a platform with strong international appeal, particularly in emerging markets. The mobile-first user base (71.43%) and high new user acquisition rate (97.6%) present both opportunities and challenges. The focus should be on converting the strong initial engagement into sustained user retention while maintaining the quality standards that drive our 61.9% engaged session rate.
The geographic diversity across 18 countries demonstrates the platform's global reach, while the technology usage patterns provide clear direction for optimization efforts. Moving forward, balancing user acquisition with retention strategies will be key to sustainable growth.
This report was generated using Google Analytics 4 data from July 10-16, 2025, focusing on user engagement, geographic performance, and technology adoption metrics.
Vote for Me as a Witness
- Go to Steemit Witness Voting
- Scroll down and type kafio.wit
- Click Vote